Track Global Conflicts in Real Time: Global Watch's Geopolitical Intelligence
When a military escalation begins, the first 24 hours define the narrative. Analysts who see the signals early, the unusual flight patterns, the naval repositioning, the news velocity spike, have a decisive advantage over those waiting for the morning briefing.
Global Watch was built to give you those 24 hours back.
A Situation Room in Your Browser
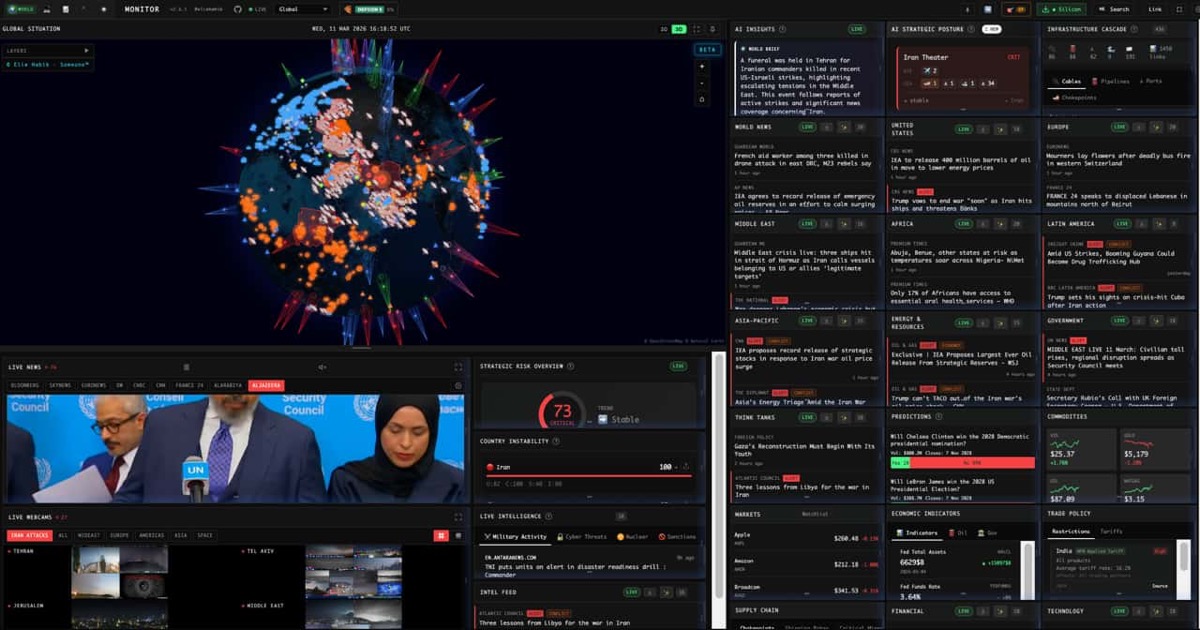
Global Watch’s core dashboard (globalwatch.vercel.app) is designed around one question: what’s happening in the world right now, and where is it getting worse?
The answer comes from layering multiple intelligence sources onto a single interactive 3D globe:
- ACLED conflict data for armed clashes, protests, and political violence
- UCDP warfare events for state-based and non-state conflicts
- Live ADS-B tracking for military aircraft positions
- AIS vessel monitoring merged with USNI fleet reports for naval movements
- 26 Telegram OSINT channels for raw, low-latency intelligence
- OREF rocket alerts with 1,480 Hebrew-to-English siren translations
- GPS/GNSS jamming zones detected from ADS-B anomalies
- NASA satellite fire detection (VIIRS) for ground-truth verification
Each layer can be toggled independently. Combine them to build a multi-source picture of any developing situation.
9 Strategic Theaters Under Continuous Assessment
Global Watch maintains real-time posture assessments for 9 operational theaters:
- Iran / Persian Gulf: Strait of Hormuz chokepoint, IRGC activity, proxy conflict indicators
- Taiwan Strait: PLA military exercises, naval deployments, airspace incursions
- Baltic Region: NATO-Russia friction, Kaliningrad corridor, submarine activity
- Korean Peninsula: DMZ incidents, missile tests, force posture changes
- Eastern Mediterranean: Israel-Hezbollah dynamics, energy disputes, naval presence
- Horn of Africa: Houthi maritime threats, Red Sea shipping disruption, piracy
- South China Sea: Island militarization, fishing militia, freedom of navigation operations
- Arctic: Resource competition, Northern Sea Route, military basing
- Black Sea: Ukraine conflict, grain corridor, naval mine risk
Each theater’s posture level is synthesized from news velocity, military movements, CII scores of involved nations, and historical escalation patterns.
The Country Instability Index (CII)
Every country monitored by Global Watch receives a real-time instability score from 0 to 100, visualized as a choropleth heatmap that turns the globe into a risk map.
The CII is computed from four weighted components:
- Baseline risk (40%): Historical conflict data, governance quality, ethnic fractionalization
- Unrest indicators (20%): Live protest counts, strike activity, civil disorder events
- Security events (20%): Active armed conflicts, terrorism incidents, border clashes
- Information velocity (20%): News volume spikes that often precede or accompany crises
Real-time boosters adjust the score based on:
- Proximity to active hotspots
- OREF rocket alert activity
- GPS jamming detection in or near the country
- Government travel advisory changes from 4 nations (US, UK, Australia, New Zealand)
The result: you can watch instability rise in real time, often before the situation makes international headlines.
Hotspot Escalation Detection
Global Watch’s escalation algorithm goes beyond showing where events are happening. It identifies where situations are getting worse using a composite score:
- News activity (35%): Sudden spikes in reporting volume for a geographic area
- CII score (25%): Baseline instability context
- Geographic convergence (25%): Multiple event types (conflict, protest, natural disaster, cyber) co-occurring within the same 1-degree grid cell within 24 hours
- Military indicators (15%): Unusual force movements, exercise activity, weapons tests
Geographic convergence is particularly powerful. When you see protests AND military deployments AND a communications outage in the same area within the same day, that pattern has predictive value that individual events don’t.
210+ Military Bases Mapped
The military infrastructure layer maps over 210 bases from 9 operators, including:
- US military installations worldwide
- Russian bases and deployment zones
- Chinese PLA facilities including South China Sea installations
- NATO forward-deployed positions
- Other allied and partner nation facilities
Each base includes facility type, operating nation, and strategic context. Overlay this with the live ADS-B and AIS layers to see how forces relate to current deployments.
Live ADS-B and AIS Fusion
Two of Global Watch’s most operationally significant layers:
ADS-B (Aircraft): Military and civilian aircraft transponder data from OpenSky, enriched by Wingbits for aircraft type identification. Filter for military callsigns to track reconnaissance flights, tanker orbits, and transport movements in real time.
AIS (Maritime): Ship positions from AISStream.io merged with editorial analysis from USNI Fleet Reports. This fusion gives you both the “where” (transponder position) and the “why” (fleet deployment context). Dark vessel detection flags ships that have gone silent, a common indicator of sanctions evasion or military operations.
Infrastructure Cascade Analysis
Conflicts don’t just affect people. They affect infrastructure that the global economy depends on.
Global Watch maps critical infrastructure alongside conflict data:
- Undersea cables carrying 95% of intercontinental internet traffic
- Oil and gas pipelines traversing conflict zones
- Nuclear facilities and their proximity to active hostilities
- AI datacenters (111 mapped globally)
- Strategic ports (83) and airports (107)
The Infrastructure Cascade panel shows what happens when a conflict zone overlaps with critical infrastructure. A pipeline through a hotspot, a cable landing station near an escalation zone. These second-order effects drive market moves and policy decisions.
26 Telegram Channels: The Raw Feed
For analysts who want unfiltered intelligence, Global Watch integrates 26 curated Telegram channels via MTProto:
The channels are tiered by reliability. Tier 1 sources are verified primary reporters. Tier 2 includes established OSINT accounts like Aurora Intel, BNO News, and DeepState. Tier 3 captures secondary aggregators for broader coverage.
Telegram often breaks conflict news 15-30 minutes before traditional media. Having these feeds alongside verified data sources lets you distinguish signal from noise.
AI Deduction and Forecasting
Global Watch’s AI capabilities aren’t just summarization. The AI Deduction panel provides interactive geopolitical timeline forecasting grounded in live headlines:
- Select a developing situation
- The AI synthesizes current data into potential escalation/de-escalation paths
- Each forecast is grounded in cited headlines and data points
- Cross-reference with Polymarket prediction data for market sentiment
This runs on your choice of LLM: local (Ollama, LM Studio), cloud (Groq, OpenRouter), or entirely in-browser (Transformers.js T5 model).
Real-World Use Cases
Conflict Monitoring for NGOs: Humanitarian organizations use Global Watch to monitor safety conditions for field staff. The CII and escalation scoring provide early warning for deteriorating situations.
Defense Research: Academic researchers studying conflict patterns use the integrated data layers to correlate military movements with political developments across multiple theaters simultaneously.
Journalism: Reporters covering conflict use Global Watch to contextualize breaking events. When a missile strikes, the map immediately shows nearby military infrastructure, recent escalation history, and what OSINT channels are saying.
Policy Analysis: Think tanks and government analysts use the Strategic Theater Posture assessments to brief decision-makers on multi-theater dynamics.
8 Regional Presets
Jump between regions instantly with 8 preset views: Global, Americas, Europe, MENA, Asia, Africa, Oceania, and Latin America. Each preset adjusts the map view and highlights region-relevant layers.
Shareable Intelligence
Build a picture, then share it. Global Watch encodes your entire view state (map position, active layers, time range) into a URL. Send it to a colleague, and they see exactly what you see.
For public sharing, the story export feature generates social-ready briefs with Open Graph images for Twitter/X, LinkedIn, WhatsApp, Telegram, and Reddit.
Monitor developing situations at globalwatch.vercel.app. Real-time geopolitical intelligence, free and open source.