Satellite Eyes: How Global Watch Brings Orbital Surveillance to Your Browser
Satellite imagery used to require government clearance or a Maxar contract. Today, a growing constellation of Earth observation satellites captures the planet daily, and Global Watch brings that data directly into your intelligence workflow.
The Orbital Surveillance Layer
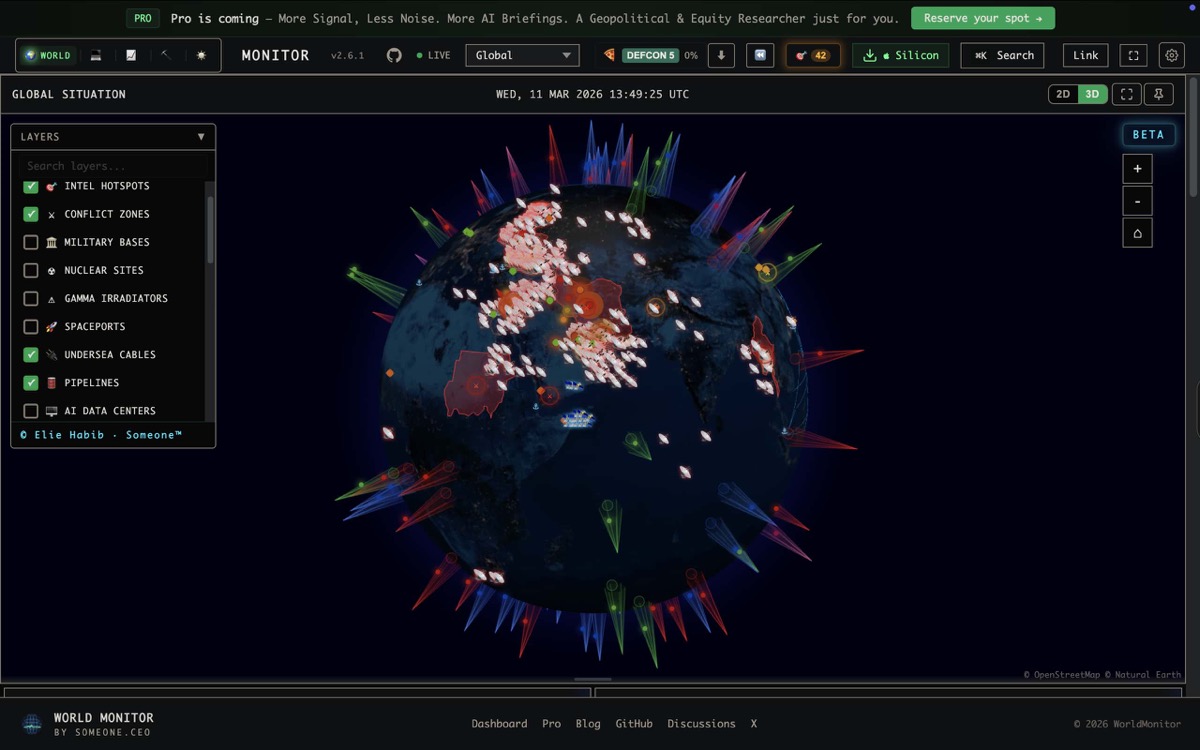
Global Watch’s orbital surveillance layer overlays satellite imagery onto both the 3D globe and flat map views. This isn’t just a static basemap. It’s searchable, time-filtered satellite data integrated with the same geopolitical intelligence layers you use for everything else.
What you get:
- Real satellite images of geopolitical hotspots
- Time-range queries to compare before and after events
- Cloud coverage percentage so you know if the image is useful
- Resolution metadata for assessing detail level
- Seamless overlay with conflict data, military bases, and infrastructure layers
STAC API: The Engine Behind the Imagery
Global Watch connects to satellite data through the STAC (SpatioTemporal Asset Catalog) API, the open standard that makes Earth observation data searchable. Instead of browsing through satellite operator portals, you search by:
- Location: Click any point on the map
- Time range: Specify when you want imagery from
- Cloud coverage: Filter out cloudy images
The system returns available satellite passes, ranked by relevance, with preview thumbnails directly in the panel.
Intelligence Use Cases for Satellite Imagery
Conflict Verification
News reports claim a military buildup near a border. The conflict layer shows increased news activity. ADS-B shows military flight patterns. Now pull satellite imagery to see if there are new vehicle concentrations, field camps, or infrastructure construction.
Satellite imagery provides the physical evidence that other intelligence signals suggest.
Infrastructure Damage Assessment
After a reported strike on a pipeline, port, or datacenter, satellite imagery shows the actual damage. Compare pre-event and post-event images using the time-range query to see what changed.
Environmental Monitoring
Track deforestation, mining expansion, flooding, and fire damage. The NASA FIRMS fire layer shows active hotspots; satellite imagery shows the aftermath and extent.
Maritime Intelligence
Combine AIS vessel tracking with satellite imagery to:
- Verify ship positions in areas where vessels go “dark” (turn off transponders)
- Monitor port congestion and new construction at strategic harbors
- Track military naval base expansion over time
Nuclear Facility Monitoring
Global Watch maps nuclear facilities worldwide. Satellite imagery adds visual verification: is there new construction? Are cooling systems active? Are there vehicle patterns suggesting operational changes?
Cross-Layer Integration
The orbital layer becomes most powerful when combined with Global Watch’s other 44 data layers:
| Situation | Intelligence Layers | + Satellite Adds |
|---|---|---|
| Military buildup | ADS-B + bases + news | Visual confirmation of troop/vehicle concentrations |
| Pipeline attack | Infrastructure + conflict | Damage extent and repair activity |
| Port blockade | AIS + maritime + news | Ship congestion visualization |
| Nuclear activity | Nuclear facilities + CII | Construction changes, thermal signatures |
| Protest camp | Conflict + Telegram OSINT | Crowd size estimation, barricade placement |
| Natural disaster | USGS + NASA FIRMS | Damage footprint, flood extent |
No other free dashboard lets you overlay satellite imagery on top of real-time conflict data, military tracking, and AI-scored intelligence, in the same view.
Resolution and Coverage
Satellite imagery resolution varies by source. Global Watch displays metadata for each image so you know what you’re working with:
- Low resolution (250m+): Weather patterns, large-scale environmental changes
- Medium resolution (10-30m): Land use changes, large military installations
- High resolution (1-5m): Individual buildings, vehicle concentrations, infrastructure details
Coverage depends on satellite revisit rates and cloud conditions. Equatorial regions have more frequent coverage; high-latitude areas may have gaps. The cloud coverage filter helps you quickly find usable images.
Desktop-Enhanced Experience
The orbital surveillance layer is available across all platforms, with the desktop app providing the smoothest experience for high-resolution imagery browsing. The Tauri app’s local Node.js sidecar handles STAC API queries efficiently, and CSP (Content Security Policy) is configured to allow satellite preview image loading from trusted sources.
How to Use It
- Open Global Watch and toggle the Orbital Surveillance layer
- Navigate to your area of interest on the map
- Open the Satellite Imagery panel
- Set your time range (last 7 days, 30 days, or custom)
- Filter by cloud coverage (less than 20% recommended for useful imagery)
- Browse available passes and click to overlay on the map
- Toggle other layers (conflicts, infrastructure, military) to cross-reference
The Future of Open Satellite Intelligence
Commercial satellite constellations are growing rapidly. More satellites mean more frequent revisits, higher resolution, and faster delivery. As this data becomes more accessible, tools like Global Watch that integrate imagery into multi-source intelligence workflows will become essential.
The days of satellite intelligence being locked in classified systems are ending. Global Watch puts orbital surveillance alongside 44 other intelligence layers, in your browser, for free.
Explore satellite imagery at globalwatch.vercel.app. Toggle the orbital surveillance layer and see the world from above.