Earthquake, Fire, Flood: Real-Time Natural Disaster Monitoring with Global Watch
On February 6, 2023, two earthquakes struck southern Turkey and northern Syria within hours of each other. Over 50,000 people died. In the first hours, before rescue teams mobilized, the clearest picture of the devastation came from seismic data, satellite fire detection, and population exposure overlays.
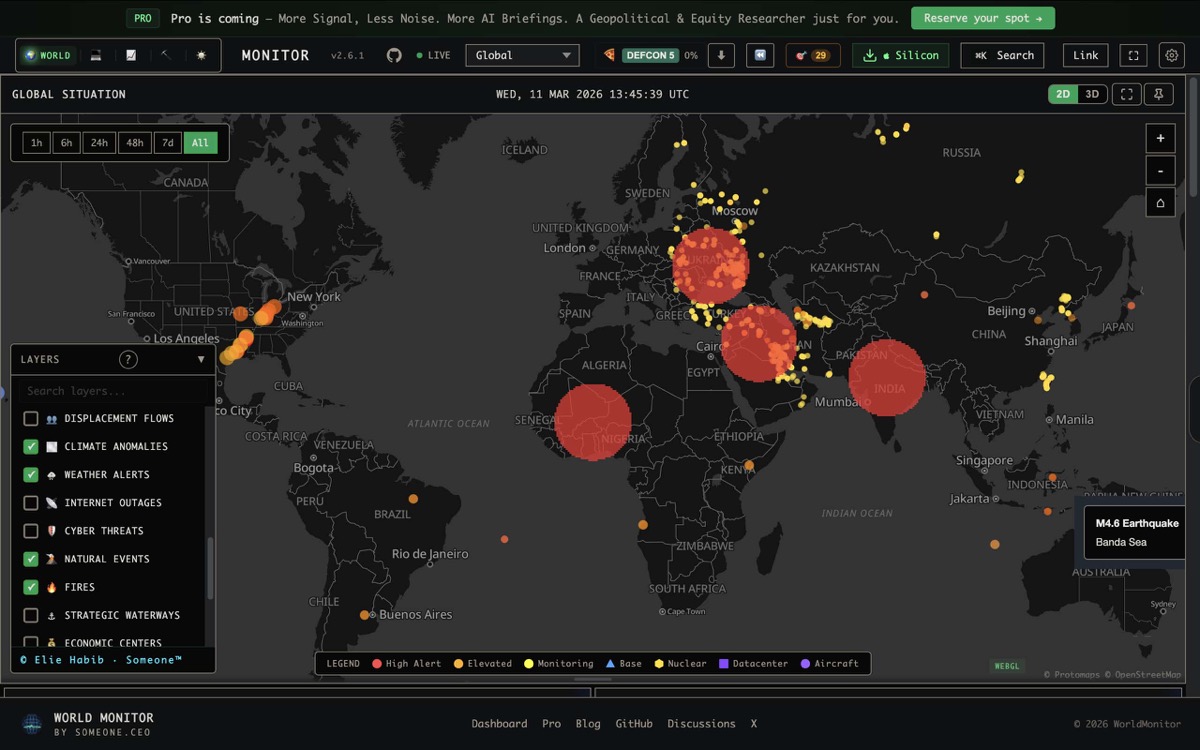
Global Watch aggregates exactly these data sources into a single, layered view, giving disaster monitors real-time situational awareness from the first tremor to the long-term recovery.
Four Disaster Data Streams, One Map
1. Earthquakes (USGS)
Global Watch integrates the U.S. Geological Survey earthquake feed for all events magnitude 4.5 and above, globally. Each earthquake appears on the map with:
- Magnitude (size-scaled marker)
- Depth (color-coded: shallow events are more destructive)
- Location with reverse-geocoded place name
- Timestamp in your local time zone
- Felt reports when available
The USGS feed updates within minutes of a seismic event. For major earthquakes, Global Watch’s news panel typically shows wire service alerts within 5-10 minutes, giving you both the raw seismic data and the human reporting side by side.
Why it matters beyond seismology: Earthquakes trigger cascading effects. A magnitude 7.0 near an undersea cable route can disrupt internet traffic for an entire region. A quake near a nuclear facility triggers safety protocols. A tremor in a politically unstable country can accelerate instability. Global Watch shows all of these connections because the earthquake data shares the map with infrastructure, nuclear facilities, and CII (Country Instability Index) overlays.
2. Satellite Fire Detection (NASA FIRMS / VIIRS)
The Visible Infrared Imaging Radiometer Suite (VIIRS) on NASA’s Suomi NPP satellite detects thermal anomalies across the planet. Global Watch maps these detections with:
- Fire Radiative Power (FRP): How intense is the fire?
- Location with sub-kilometer accuracy
- Detection confidence level
- Time of satellite pass
This isn’t just wildfire tracking. Satellite fire detection reveals:
- Industrial fires at refineries, chemical plants, or manufacturing facilities
- Agricultural burning that affects commodity markets (palm oil, sugarcane)
- Conflict-related fires from strikes, arson, or scorched-earth tactics
- Urban fires in densely populated areas
When you see a VIIRS hotspot cluster in an area where the conflict layer also shows activity, you may be looking at the thermal signature of an attack before any news outlet reports it.
3. Volcanic Eruptions and Severe Weather (NASA EONET)
NASA’s Earth Observatory Natural Event Tracker (EONET) feeds into Global Watch for:
- Active volcanic eruptions
- Large-scale flooding events
- Severe storms and tropical cyclones
- Dust storms affecting visibility and aviation
- Iceberg calving events
Volcanic eruptions are particularly significant for global logistics: a single eruption can close airspace for days (as Eyjafjallajokull did in 2010), disrupt semiconductor manufacturing (sulfur dioxide contamination), and affect global temperature patterns.
4. Climate Anomalies
Global Watch tracks temperature, precipitation, and sea level anomalies that indicate developing conditions:
- Drought indicators that threaten agricultural output and water-dependent manufacturing
- Flooding risk from sustained precipitation anomalies
- Marine heatwaves that affect fishing yields and ocean shipping routes
Population Exposure: Who’s at Risk?
Raw disaster data tells you where something happened. Population exposure overlays tell you who’s affected.
Global Watch integrates WorldPop population density data with disaster events to estimate:
- How many people live within the impact zone
- Urban vs. rural distribution of affected populations
- Proximity to critical infrastructure (hospitals, airports, ports)
When an earthquake strikes, the population exposure overlay immediately shows whether it hit a dense urban area or a rural region, dramatically changing the humanitarian response calculation.
Infrastructure Cascade: What Breaks Next?
Natural disasters don’t just affect people. They disrupt the systems people depend on.
Global Watch’s Infrastructure Cascade panel automatically calculates second-order effects when a disaster event overlaps with critical infrastructure:
- Undersea cables within range of an earthquake epicenter
- Pipelines crossing flood zones
- Ports exposed to storm surge
- Nuclear facilities near seismic activity
- Datacenters in wildfire zones
- Power grid nodes in affected regions
A magnitude 6.5 earthquake off the coast of Portugal might not make global headlines, but if three undersea cables cross that zone, financial transactions between Europe and the Americas could slow for days. Global Watch makes that connection visible.
Displacement Flows: The Human Aftermath
Global Watch integrates UNHCR displacement data to show refugee and internally displaced person (IDP) migration patterns. When a disaster strikes, you can see:
- Historical displacement from the affected region
- Existing refugee populations that may face compounding vulnerability
- Transit routes and host countries likely to receive new displacement
This data is invaluable for humanitarian organizations planning response operations.
Practical Workflows
For Emergency Management
- Earthquake alert appears on map (USGS, magnitude 6.2)
- Check population exposure overlay for affected population estimate
- Review infrastructure cascade for damaged utilities and transport
- Toggle satellite fire detection for secondary fires
- Check webcam feeds from nearest major city
- Monitor news panel for early situation reports
- Share situation briefing via URL state to team
For Insurance and Reinsurance
- Set custom keyword monitors for “earthquake,” “wildfire,” “flood”
- When triggered, review magnitude/intensity and location
- Overlay population density for exposure estimation
- Check infrastructure layer for insured asset proximity
- Compare with CII for political stability context (claims processing complexity)
- Generate AI brief for initial loss assessment context
For Humanitarian Response
- Monitor CII for countries with rising instability (pre-existing vulnerability)
- When disaster strikes vulnerable region, assess compounding risk
- Review displacement data for existing humanitarian burden
- Check port and airport status for logistics access
- Monitor Telegram OSINT for ground-truth reports from local observers
- Cross-reference with travel advisories for staff safety
For Commodity Markets
- Satellite fire detection triggers in major agricultural region
- Check FRP intensity and affected area
- Overlay with crop/commodity production zones
- Assess pipeline/port proximity for energy commodity impact
- Review AI-generated brief for market implications
- Monitor commodity price panel for immediate price response
Real-Time Alerts Through Custom Keyword Monitors
Global Watch’s Custom Keyword Monitors let you set persistent alerts for natural disaster terms:
- Set monitors for “earthquake,” “tsunami,” “wildfire,” “hurricane,” “volcanic”
- Color-code each monitor category
- When matching headlines appear in the 435+ RSS feeds, they’re highlighted in your custom color
- Monitors persist across sessions via localStorage
Combined with the map layers, you have a complete early warning system: spatial data on the map, textual alerts in the news panel, AI analysis in the brief, and live video for ground truth.
Why Global Watch for Disaster Monitoring
Dedicated disaster monitoring platforms exist (GDACS, ReliefWeb, PDC Global). Global Watch’s advantage isn’t replacing them. It’s integrating disaster data with:
- Geopolitical context (CII scores, conflict data)
- Infrastructure dependency mapping
- Financial market impact (commodity prices, exchange status)
- AI analysis for rapid situation synthesis
- Multi-source verification (satellite, seismic, news, webcam, OSINT)
A disaster doesn’t happen in isolation. Its impact depends on the political stability of the affected country, the infrastructure that fails, the markets that react, and the humanitarian capacity available. Global Watch shows all of these in one view.
Monitor natural disasters in context at globalwatch.vercel.app. USGS, NASA, and AI analysis, all in one free dashboard.