Monitor Global Supply Chains and Commodity Disruptions in Real Time
In March 2021, the Ever Given blocked the Suez Canal for six days. Global trade lost an estimated $9.6 billion per day. Most supply chain teams learned about it from Twitter.
The companies that recovered fastest were the ones that already had multi-source monitoring in place: ship positions, port congestion data, commodity prices, and alternative route analysis, all visible before the situation hit mainstream news.
Global Watch’s Commodity Monitor (globalwatchcommodity.vercel.app) gives every supply chain team that capability.
The Supply Chain Visibility Gap
Modern supply chains are global, interconnected, and fragile. A single disruption can cascade across industries:
- A drought in Taiwan affects semiconductor fabrication water supply
- A coup in Niger disrupts uranium supply for European nuclear plants
- Houthi attacks in the Red Sea force rerouting around the Cape of Good Hope
- A port strike in Montreal affects grain exports to North Africa
- GPS jamming in the Baltic disrupts automated shipping navigation
Traditional supply chain tools focus on your own logistics: purchase orders, shipment tracking, inventory levels. They don’t tell you about the geopolitical, military, and environmental events that create the disruptions in the first place.
Global Watch fills that gap.
Live Commodity Pricing
The Commodity Monitor tracks real-time prices for:
Energy:
- Crude oil (WTI and Brent)
- Natural gas (Henry Hub, TTF)
- Coal and uranium
Precious Metals:
- Gold, silver, platinum, palladium
Critical Minerals:
- Lithium, cobalt, nickel
- Rare earth elements
- Copper, aluminum, zinc
Agricultural:
- Wheat, corn, soybeans
- Coffee, cocoa, sugar
- Cotton, lumber
Prices are sourced from CME, ICE, LME, and other major exchanges. The Commodity panel shows current price, daily change, and trend indicators.
10 Commodity Exchange Hubs Mapped
Global Watch maps the world’s 10 major commodity exchanges:
- CME Group (Chicago) - Energy, metals, agriculture
- ICE (Atlanta/London) - Energy, soft commodities
- LME (London) - Base metals
- SHFE (Shanghai) - Metals, energy
- DCE (Dalian) - Iron ore, agriculture
- TOCOM (Tokyo) - Precious metals, rubber
- DGCX (Dubai) - Gold, currency futures
- MCX (Mumbai) - Multi-commodity
- Rotterdam (Netherlands) - European energy hub
- Houston (Texas) - North American energy
Click any exchange for trading hours, primary instruments, and current market status.
83 Strategic Ports Under Watch
Maritime chokepoints and major ports are the pressure points of global trade. Global Watch maps 83 strategic ports with:
- Current operational status
- Geographic chokepoint proximity (Suez, Strait of Hormuz, Malacca, Panama Canal)
- Connection to commodity supply chains
- Regional conflict exposure
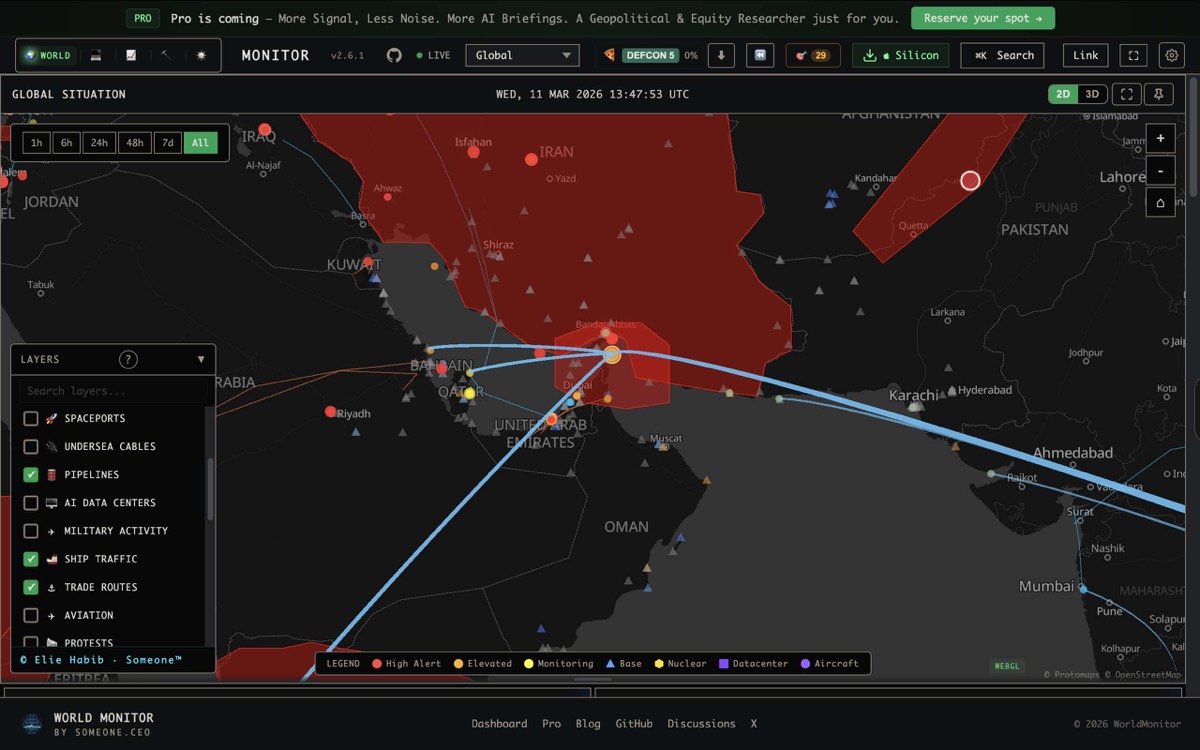
When you overlay the conflict layer, you immediately see which ports are near active hotspots. When Houthi attacks escalate in the Red Sea, you can see which ports are affected and which shipping routes need rerouting, all in one view.
AIS Maritime Tracking
Global Watch’s AIS (Automatic Identification System) layer shows live vessel positions from AISStream.io, merged with USNI fleet reports. For supply chain monitoring, this means:
- Track bulk carriers moving commodities between ports
- Detect dark vessels that have turned off transponders (potential sanctions evasion)
- Monitor naval presence near shipping lanes that could signal disruption
- Identify congestion at major ports by vessel density
The USNI merge adds editorial context: which naval task forces are deployed where, and why. This is the difference between seeing dots on a map and understanding the security environment around your shipping routes.
Pipeline and Undersea Cable Infrastructure
Global Watch maps the physical infrastructure that global trade depends on:
Pipelines:
- Major oil and gas pipelines worldwide
- Route visualization through conflict zones
- Proximity alerts when pipeline routes cross escalating hotspots
Undersea Cables:
- Fiber optic cables carrying 95% of intercontinental data
- Landing stations and repair zone indicators
- NGA (National Geospatial-Intelligence Agency) navigational warnings for cable repair operations
For digital supply chains (cloud services, financial transactions, communications), undersea cable disruption is as significant as a port closure. Global Watch shows both in the same view.
Mining and Extraction Sites
The mining layer maps active mining operations for critical minerals alongside:
- Operating companies
- Mineral type (lithium, cobalt, rare earth, copper)
- Country risk via CII (Country Instability Index)
- Proximity to conflict zones
When a country’s CII starts climbing, supply chain teams can proactively assess which critical mineral supply lines are at risk.
The Infrastructure Cascade Panel
This is where Global Watch’s multi-domain approach provides unique value. The Infrastructure Cascade panel shows second-order effects of disruptions:
A conflict escalation in Region X exposes:
- 3 undersea cables within 600km
- 2 pipeline routes through the area
- 1 major port with reduced operational capacity
- 2 mining operations that may suspend activity
These cascade effects are what turn a localized incident into a global supply chain event. Traditional monitoring tools show the incident. Global Watch shows the blast radius.
Natural Disaster Monitoring
Supply chains don’t just face geopolitical risk. Environmental events are equally disruptive:
- USGS Earthquakes (M4.5+): Automatic alerts for seismic events near industrial infrastructure
- NASA FIRMS (VIIRS): Satellite-detected fires that could affect agricultural regions or industrial facilities
- NASA EONET: Volcanic eruptions, floods, and severe storms
- Cloudflare Radar: Internet outages that disrupt digital supply chains
All of these layer onto the same map as your commodity and infrastructure data.
GPS Jamming: The Invisible Shipping Risk
An under-discussed supply chain risk: GPS/GNSS jamming and spoofing. Ships rely on GPS for navigation, and jamming zones (detected by Global Watch from ADS-B anomaly data) can:
- Force ships to rely on less precise navigation
- Trigger automated route changes that add days to voyages
- Indicate military activity that could escalate to shipping lane closures
Global Watch maps these jamming zones using H3 hexagonal grid classification, updated in real time from aviation transponder anomalies.
Practical Workflows for Supply Chain Teams
Daily Morning Check:
- Open globalwatchcommodity.vercel.app
- Review commodity price changes in the dashboard
- Check the CII heatmap for rising instability in sourcing countries
- Scan hotspot escalation scores for new disruption risks
- Review the AI-generated World Brief for overnight developments
Disruption Response:
- Event detected (earthquake, conflict, port closure)
- Toggle relevant map layers (ports, shipping routes, infrastructure)
- Assess cascade effects via the Infrastructure Cascade panel
- Check AIS for vessel positions and rerouting patterns
- Review AI dossier for the affected country
- Share situation briefing via URL state sharing
Quarterly Risk Assessment:
- Review CII trends for all sourcing countries
- Map critical mineral supply lines against conflict data
- Identify infrastructure chokepoints with escalation exposure
- Cross-reference with prediction market data for forward-looking risk
- Export findings via story sharing for stakeholder briefings
Free Beats Expensive When Speed Matters
Enterprise supply chain risk platforms (Resilinc, Everstream Analytics, Interos) charge five to six figures annually and require weeks of onboarding. Global Watch is available now, in your browser, for free.
It’s not a replacement for a full supply chain management platform. It’s the situational awareness layer that tells you where to look, before your logistics system shows delays.
Start monitoring at globalwatchcommodity.vercel.app. Free real-time intelligence for supply chain professionals.